Central Texas
Author: John Gage
Background/Overview
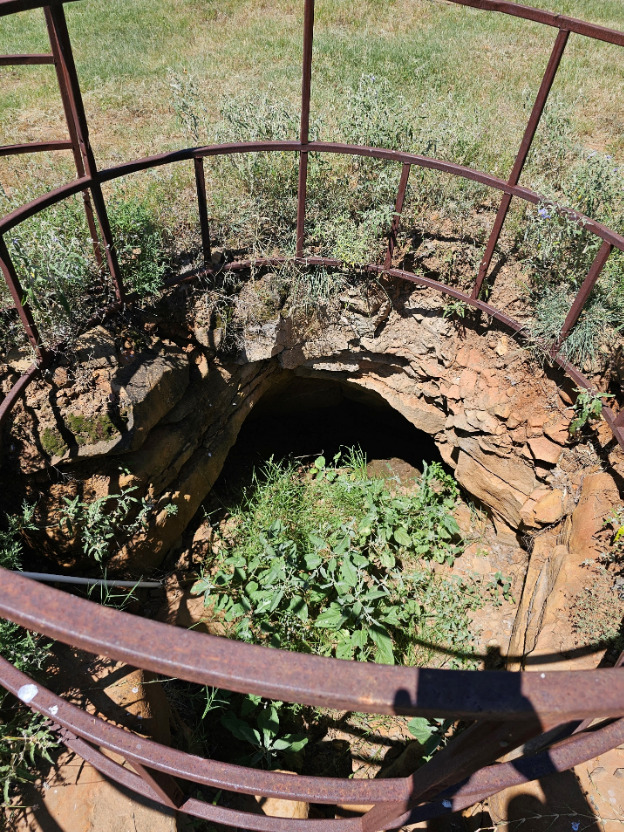
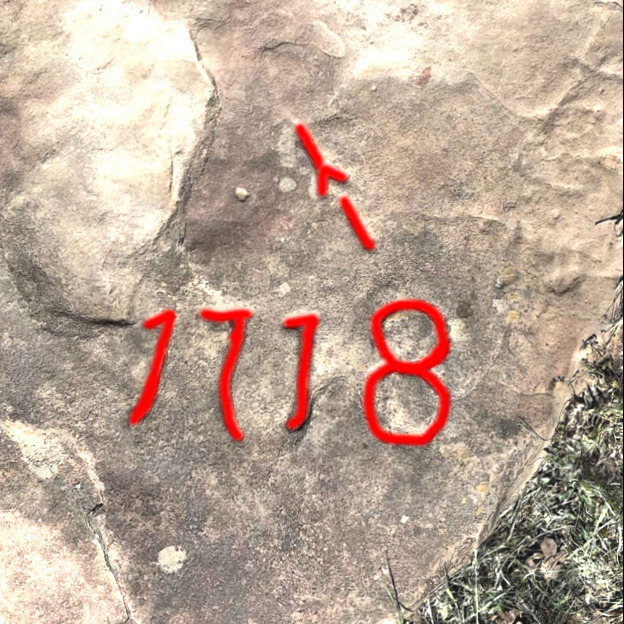
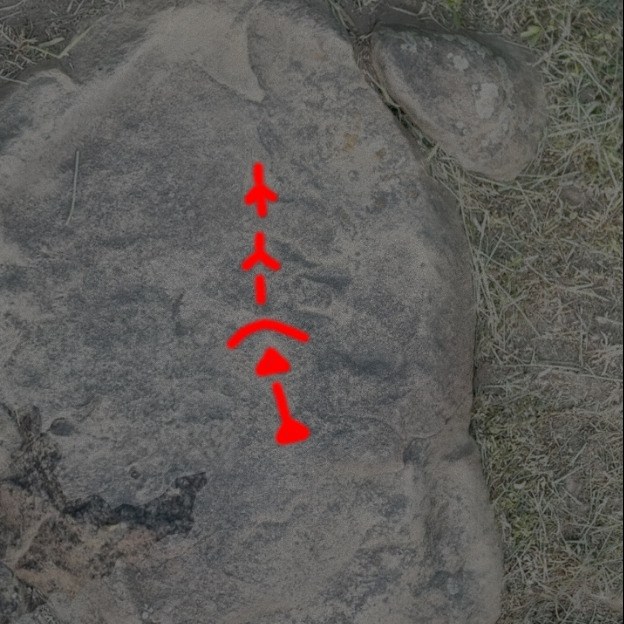
There is a property in Central Texas that has a depression that was once filled in with rock and soil. A prior owner of the property performed the backfill to eliminate the risk of livestock falling into the depression and becoming trapped and injured. The prior owner shared that before backfilling the depression, he went down into the hole and estimated he was approximately 20’ below the surface. The location of the depression is located near the edge of a bluff which extends back to a hill which is approximately 150’ higher in elevation than the surrounding land of the depression. Currently the depression (Figure 1) has been excavated down to 9’. During that excavation it was discovered that at some point mortar was applied to a section of the opening. One could only speculate that the mortar was applied to reinforce the opening. An interesting observation is that you can decern lime chunks in the mortar. Other intriguing discoveries within proximity to the depression are two stone carvings (Figure 2 and Figure 3). The carvings in figure 3 appear to be pointing to the depression.
Being human curiosity took over as questions came to mind. Was the depression man-made or naturally formed? If man-made what was the purpose? How deep is the depression? Does it extend horizontally? These were just a few of the questions that became the driver for this project. Not being in the geophysical field, we started to research the various ways one could “see” under the ground to answer the above questions. Electrical Resistivity Imaging (ERI) was chosen due to the characteristics of the project. We started off using a 4 wire earth resistance soil resistivity tester to perform vertical electrical sounding (VES) around the depression. The results indicated there was an anomaly surrounding the depression. Now we needed to explore this anomaly. We investigated renting commercial meters that were capable of multi-electrode resistivity imaging. However, renting was not feasible due to the cost and time restraints. I then ran across the OhmPi project and decided to build one instead.
Build/Requirements
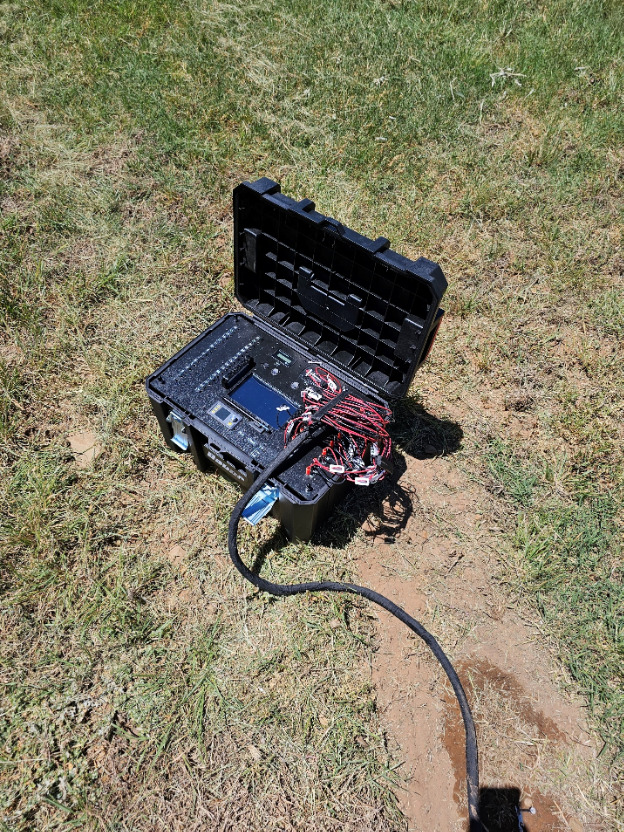
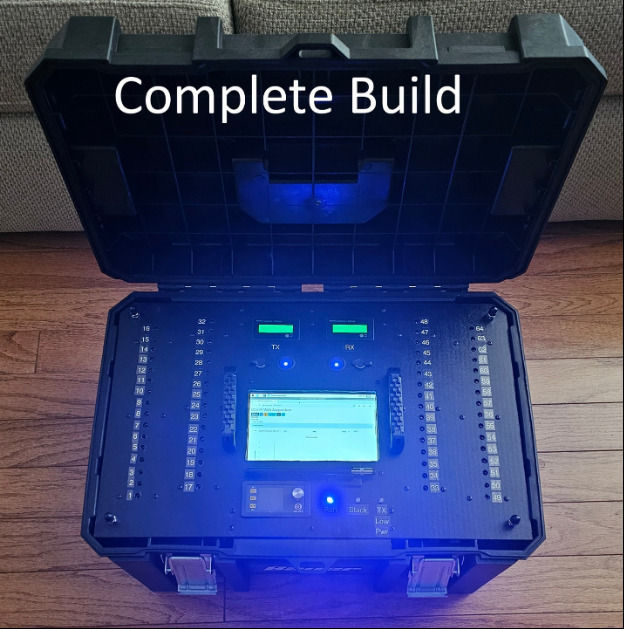
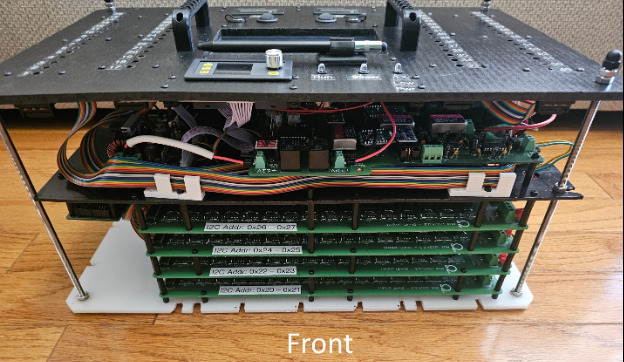
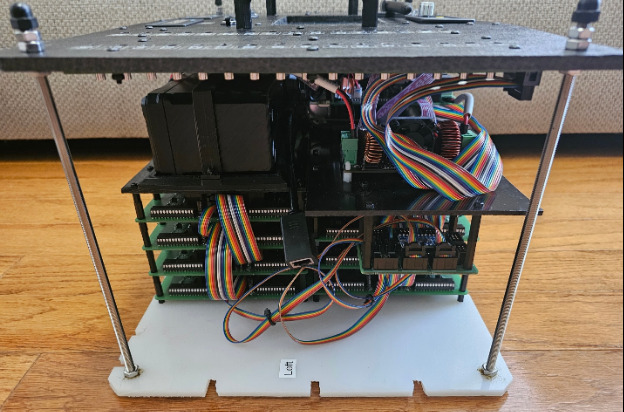
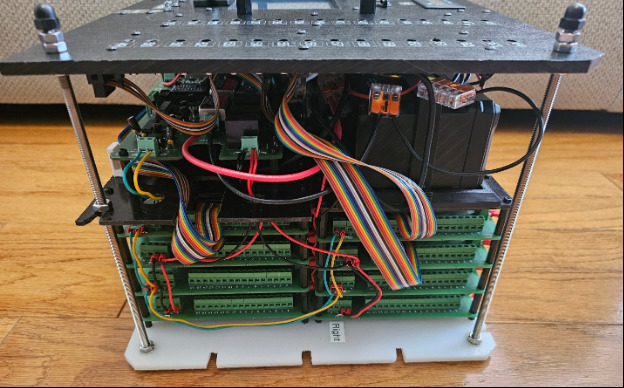
The requirements for the build were, we needed a portable, stand-alone resistivity meter that had the capability to reach the target depth and be relatively simple to setup. Expanding upon the OhmPi Lite (32 electrodes) build we ended up going with the following configuration:
1 - Measurement Board v2024
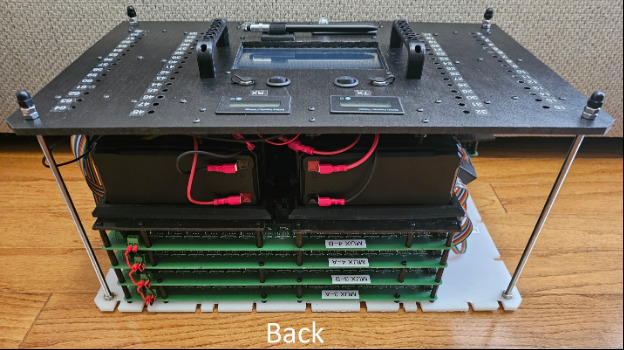
8 - MUX Board v2024
1 - i2C_ext v2024 (I2C Multiplexer) ** Port 0 appears to be reserved by the Raspberry Pi OS
1 - DPH5005 Power Supply
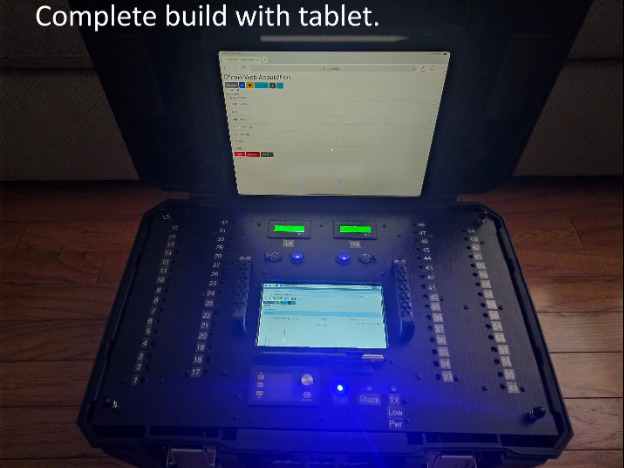
1 - 7” Touch Screen
2 - Battery Monitors
2 - 12V 7Ah LiFePO4 Batteries
2 - Battery Charging Ports
4 - Banana pluggable electrode take-outs PCBs
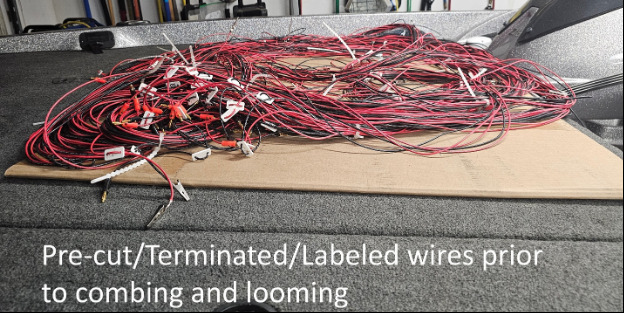
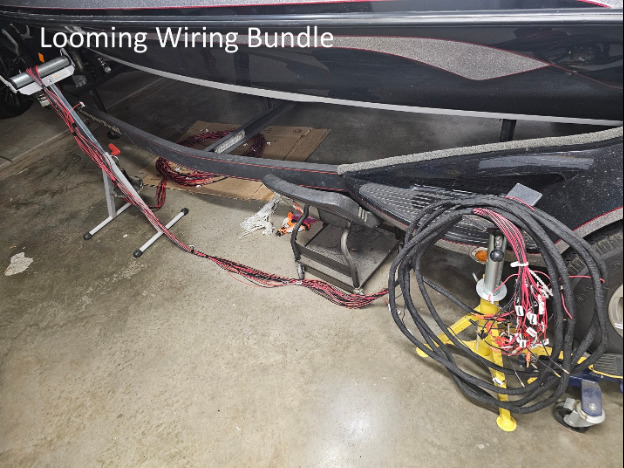
2 - 32 conductor cable bundles with banana plugs on one end and alligator clips on the other
2 - 1/4” HDPE boards
2 - 1/8” HDPE boards
1 - Bauer toolbox model 201322M-B
The configuration permits a total of 64 electrodes. The conductor cable has the alligator clip take-outs every 1 meter.
Below you will find the links to the cut and drill templates that were used for the build along with the 3d models that were printed in the build.
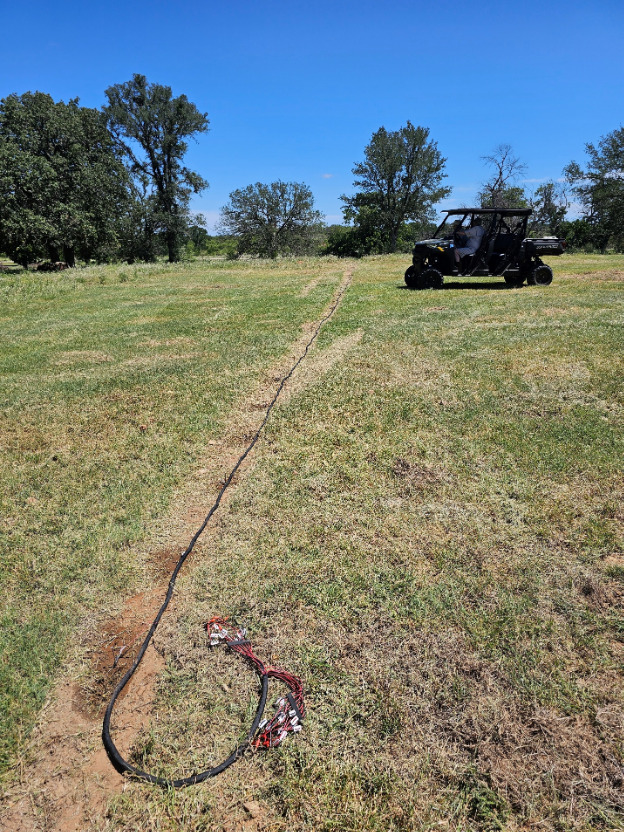
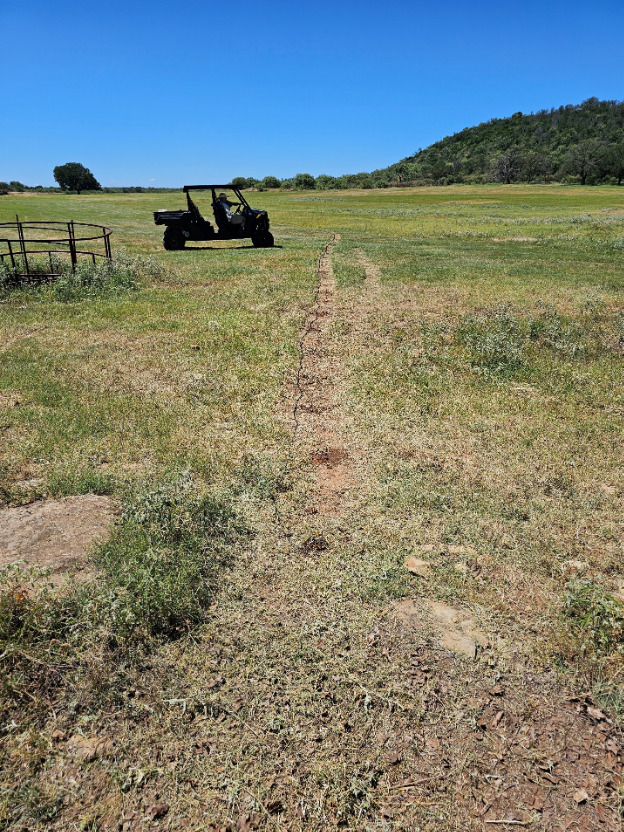
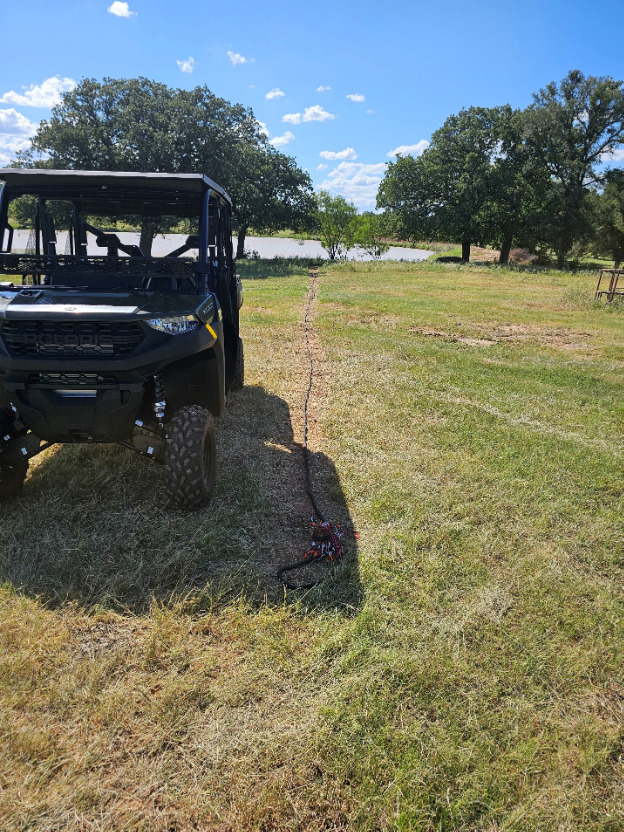
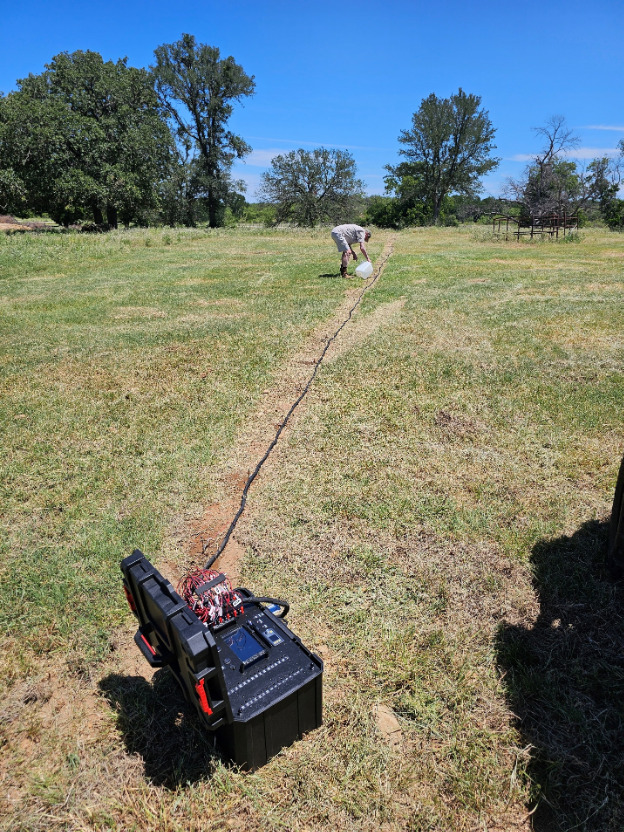
Implementation
To perform a survey, we strip the ground of any grass. We then lay out 6” stainless steel landscape spikes that has been pre-marked for depth of insertion. These spikes (electrodes) are laid out and driven into the ground every 1 meter. We then water the electrodes and layout the multi-conductor cable and attach the take-outs to the electrodes via alligator clips. Each conductor has a label on the take-out and banana plug end indicating which electrode the wire is for. The banana plugs are then inserted into the meter. The survey is initiated/configured via the touch screen or via an ad-hoc connection via a tablet or laptop.